

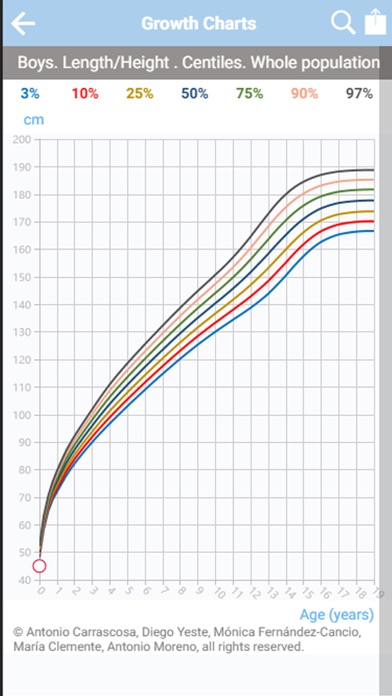


Register dates, weights and lengths or heights of your (many) children, and see a plot of their longitudinal data (introduced or calculated) on five different growth chart modalities, each one representing seven centile and Z-score (SDS) smoothed lines:
• Length - Height for age
• Weight for age
• Growth velocity for age
• Body mass index for age (BMI)
• Tri-ponderal mass index for age (TMI)
In addition, height, weight and calculated growth velocity for age have six different chart groups, according to the age of their pubertal growth spurt onset: one group representing the whole population and one group for each of the five different pubertal maturity tempos (from very-early to very-late). BMI and TMI are calculated and plotted only against one growth chart group, representing the whole population (no significant differences between pubertal maturity groups).
You will learn how to use Growth Charts, and look at the standards from growth studies as the Barcelona Longitudinal Growth Study 1995-2017, representing a Millennials’ population.